Monitoring palm oil mill production, OER and losses
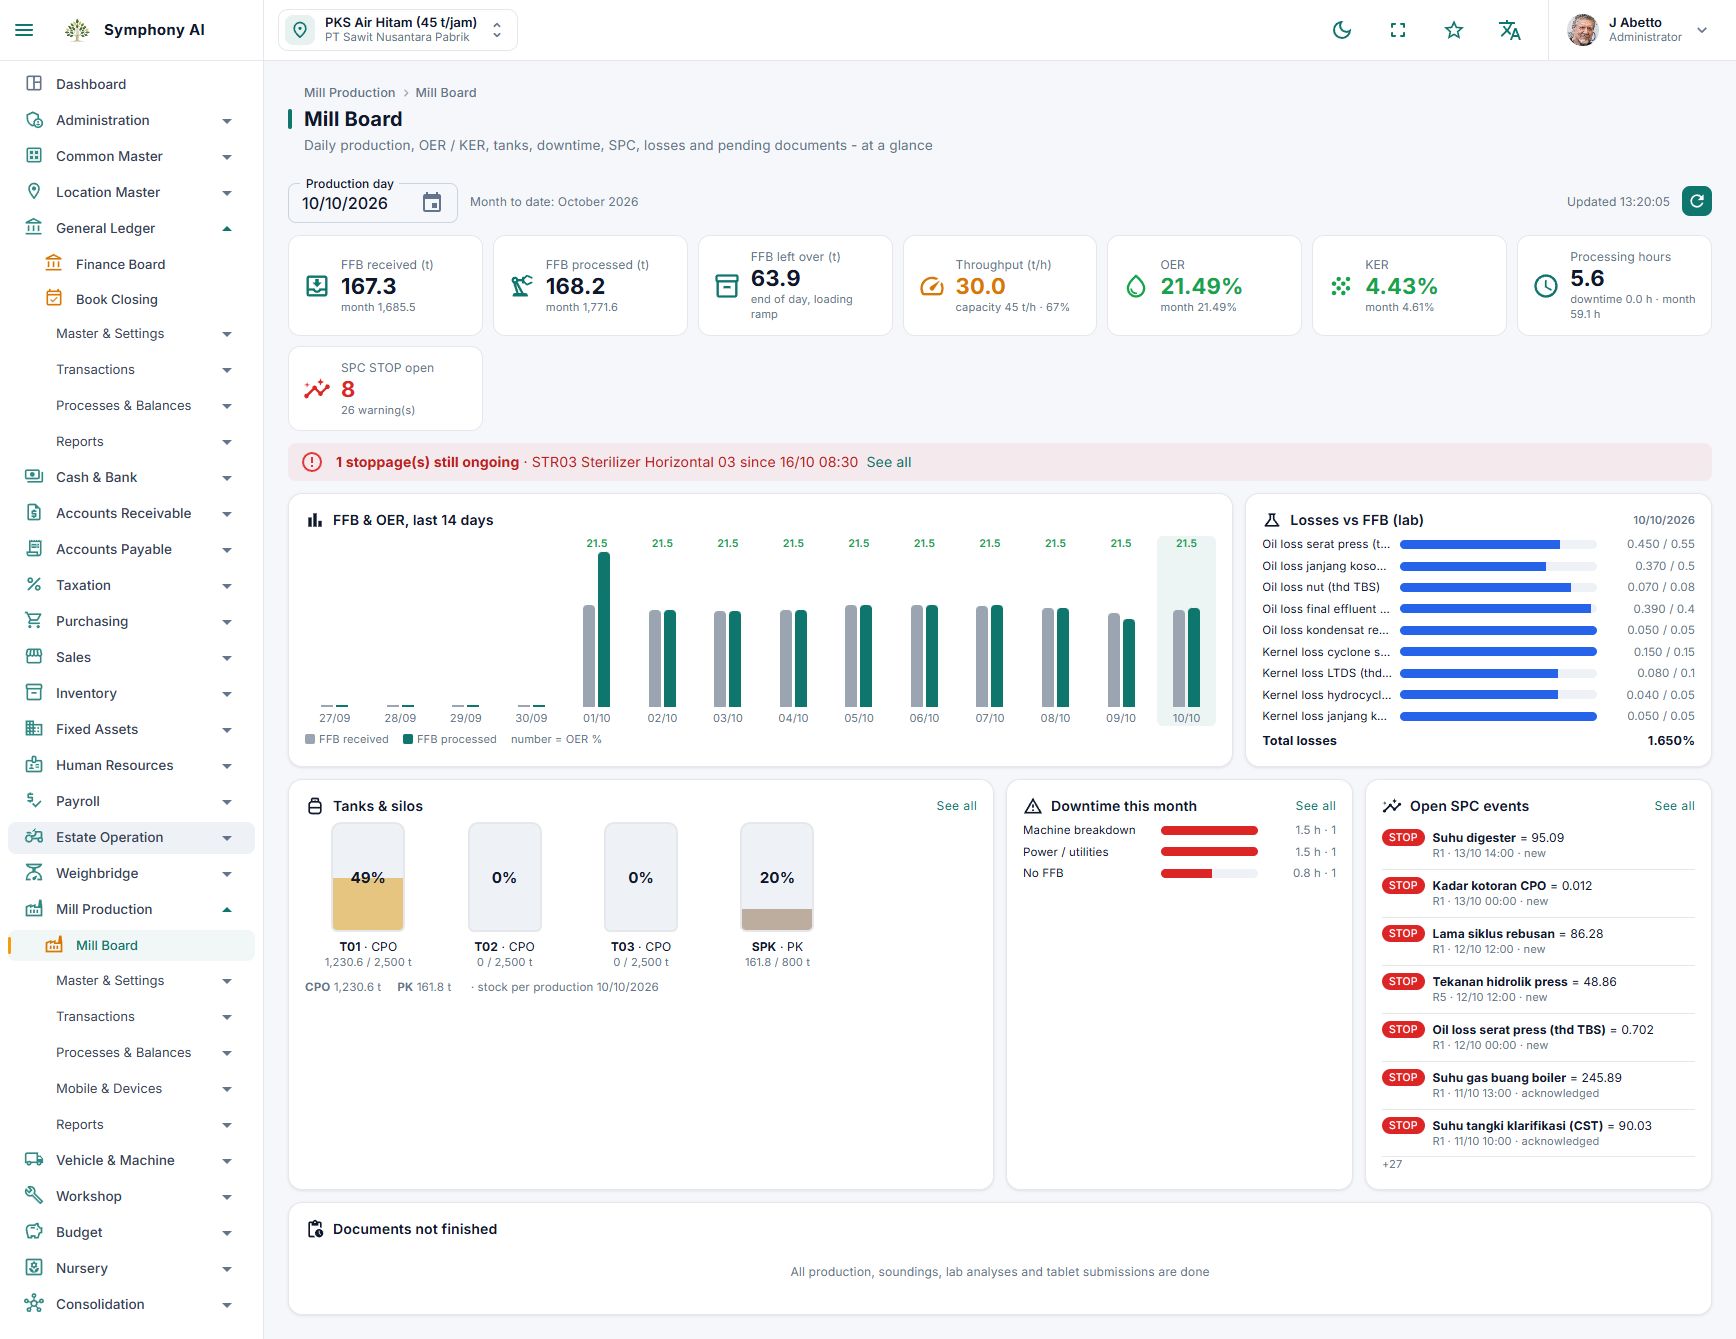
A production dashboard should help management ask better questions about the mill. Throughput, extraction rate, stock and losses describe related but different parts of the operation. Compare them using consistent periods, units and measurement methods before deciding whether a change represents an operating problem or a reporting difference.
Agree on the reporting period and material basis
Distinguish fresh fruit bunches received from fruit actually processed. Loads received late in the day may not be processed in that same period. Define the cut-off for weighing, production and stock reporting so comparisons use a consistent basis. Review carry-over material rather than treating all receipts as immediate throughput.
Read OER with its denominator
Oil extraction rate is commonly expressed as CPO produced divided by fresh fruit bunches processed, multiplied by 100. For a meaningful comparison, use the same reporting period and compatible mass units. Investigate how production is determined and reconciled with stock movements. A change in tank stock alone is not production because receipts, dispatches and other movements can also affect it.
Keep sounding and production reconciliation connected
Tank sounding provides an input to stock measurement, subject to the approved calibration and conversion method. Review opening stock, production, dispatches and closing stock together. Establish who validates the measurements and investigates differences. The daily production view should make the reporting basis understandable to both operations and management.
Interpret losses and SPC in context
Loss figures need a clearly stated sampling method and denominator. Percentages on different bases should not simply be added together. Statistical process control, or SPC, helps review process behaviour against configured limits and investigation rules; a signal should prompt a check of the measurement and operating conditions. Logsheet observations help explain what was happening at that time.
Connect the dashboard to a responsible action
Symphony’s mill workflow includes production, sounding, logsheet and SPC views. Use the review meeting to assign an owner, a follow-up action and a time for checking the result. SCADA integration is optional and must be scoped for the equipment and signals at your plant. Confirm which values are entered manually and which are obtained through an agreed integration.
Take this to your next review
- Separate fruit received from fruit processed.
- Use a consistent period, unit and OER denominator.
- Reconcile tank stock with production and dispatches.
- Check sampling bases before comparing losses.
- Assign owners to exceptions and confirm optional SCADA scope.
A common question
Does a higher OER always mean better mill performance?
It should be interpreted alongside fruit characteristics, measurement consistency, losses and operating conditions. Review the underlying records before attributing a change to a particular intervention.
Review the product screens and discuss how the workflow fits your organisation. Availability and integrations follow the agreed implementation scope.
View product details →