SPC in a Palm Oil Mill: 7 Benefits of Statistical Process Control
Most mills record process readings every hour, but the numbers are usually checked only after losses or quality complaints appear. This guide explains what statistical process control (SPC) is and the seven practical benefits it brings to a palm oil mill.
Key takeaways
- SPC shows whether a process is stable or drifting, not just whether one reading is in or out of spec.
- Early signals let operators correct sterilisation, pressing and clarification before oil is lost.
- Shared control charts give every shift the same standard and a clear handover.
- SPC works best when readings come from logsheets or SCADA directly into the ERP.
What is SPC in a palm oil mill?
Statistical process control (SPC) uses control charts to show how a process parameter behaves over time. Each chart has a centre line and upper and lower control limits calculated from the mill’s own data.
- Common cause: normal, small variation that is part of the process.
- Special cause: a shift, trend or outlier that signals something has changed, such as a worn screw press, a sterilizer cycle cut short or a clarifier running too cold.
- Control limits vs. specification: specification says what is acceptable; control limits say what is normal for your process. A reading can be within spec and still be a warning sign.
Which mill parameters to monitor with SPC
Start with the parameters that most directly drive oil losses and CPO quality. Agree sampling frequency and the responsible station for each one.
- Sterilisation: pressure, cycle time and temperature.
- Digester and press: digester temperature, press pressure or amperage.
- Clarification: oil temperature, settling tank levels, sludge oil content.
- Oil losses: oil in fibre, nut, EFB and final effluent.
- CPO quality: free fatty acid (FFA), moisture and dirt.
- Kernel: kernel losses and kernel moisture.
7 benefits of SPC for a palm oil mill
SPC turns the readings a mill already collects into early, actionable signals.
- Lower oil losses: drift in press or clarification parameters is visible within a shift, so oil is recovered instead of ending up in fibre, EFB or effluent.
- More consistent CPO quality: trends in FFA, moisture and dirt are caught before a tank falls out of the buyer’s specification.
- Earlier warning of equipment problems: a slow trend in press amperage or sterilizer cycle time often points to wear or a fault before a breakdown.
- One standard for every shift: all shifts work to the same control limits, so decisions depend less on individual experience.
- Clearer shift handover: the next shift sees which stations were stable and which raised alarms, with the actions already taken.
- Faster root-cause analysis: when OER or losses change, the charts show when and where the process moved, so the team investigates the right station.
- Traceable records for audits and management: readings, alarms and follow-up actions are stored with time and user, supporting internal reviews and quality or sustainability audits.
How to start SPC in your mill
Introduce SPC step by step so operators trust the charts.
- Pick 5–10 key parameters: focus on losses and CPO quality first.
- Make data capture reliable: use a mobile logsheet at each station or connect SCADA, so readings are not re-typed.
- Calculate control limits from stable data: use a period of normal operation, and review limits after major changes.
- Agree alarm rules and owners: decide which patterns trigger an alarm and who responds at each station.
- Review weekly: compare alarms with losses, OER and maintenance records, and adjust limits or procedures.
SPC in Symphony mill management
Symphony brings SPC into the mill module of the ERP, next to production, stock and costs.
- Mobile logsheet: operators record station readings on an Android phone.
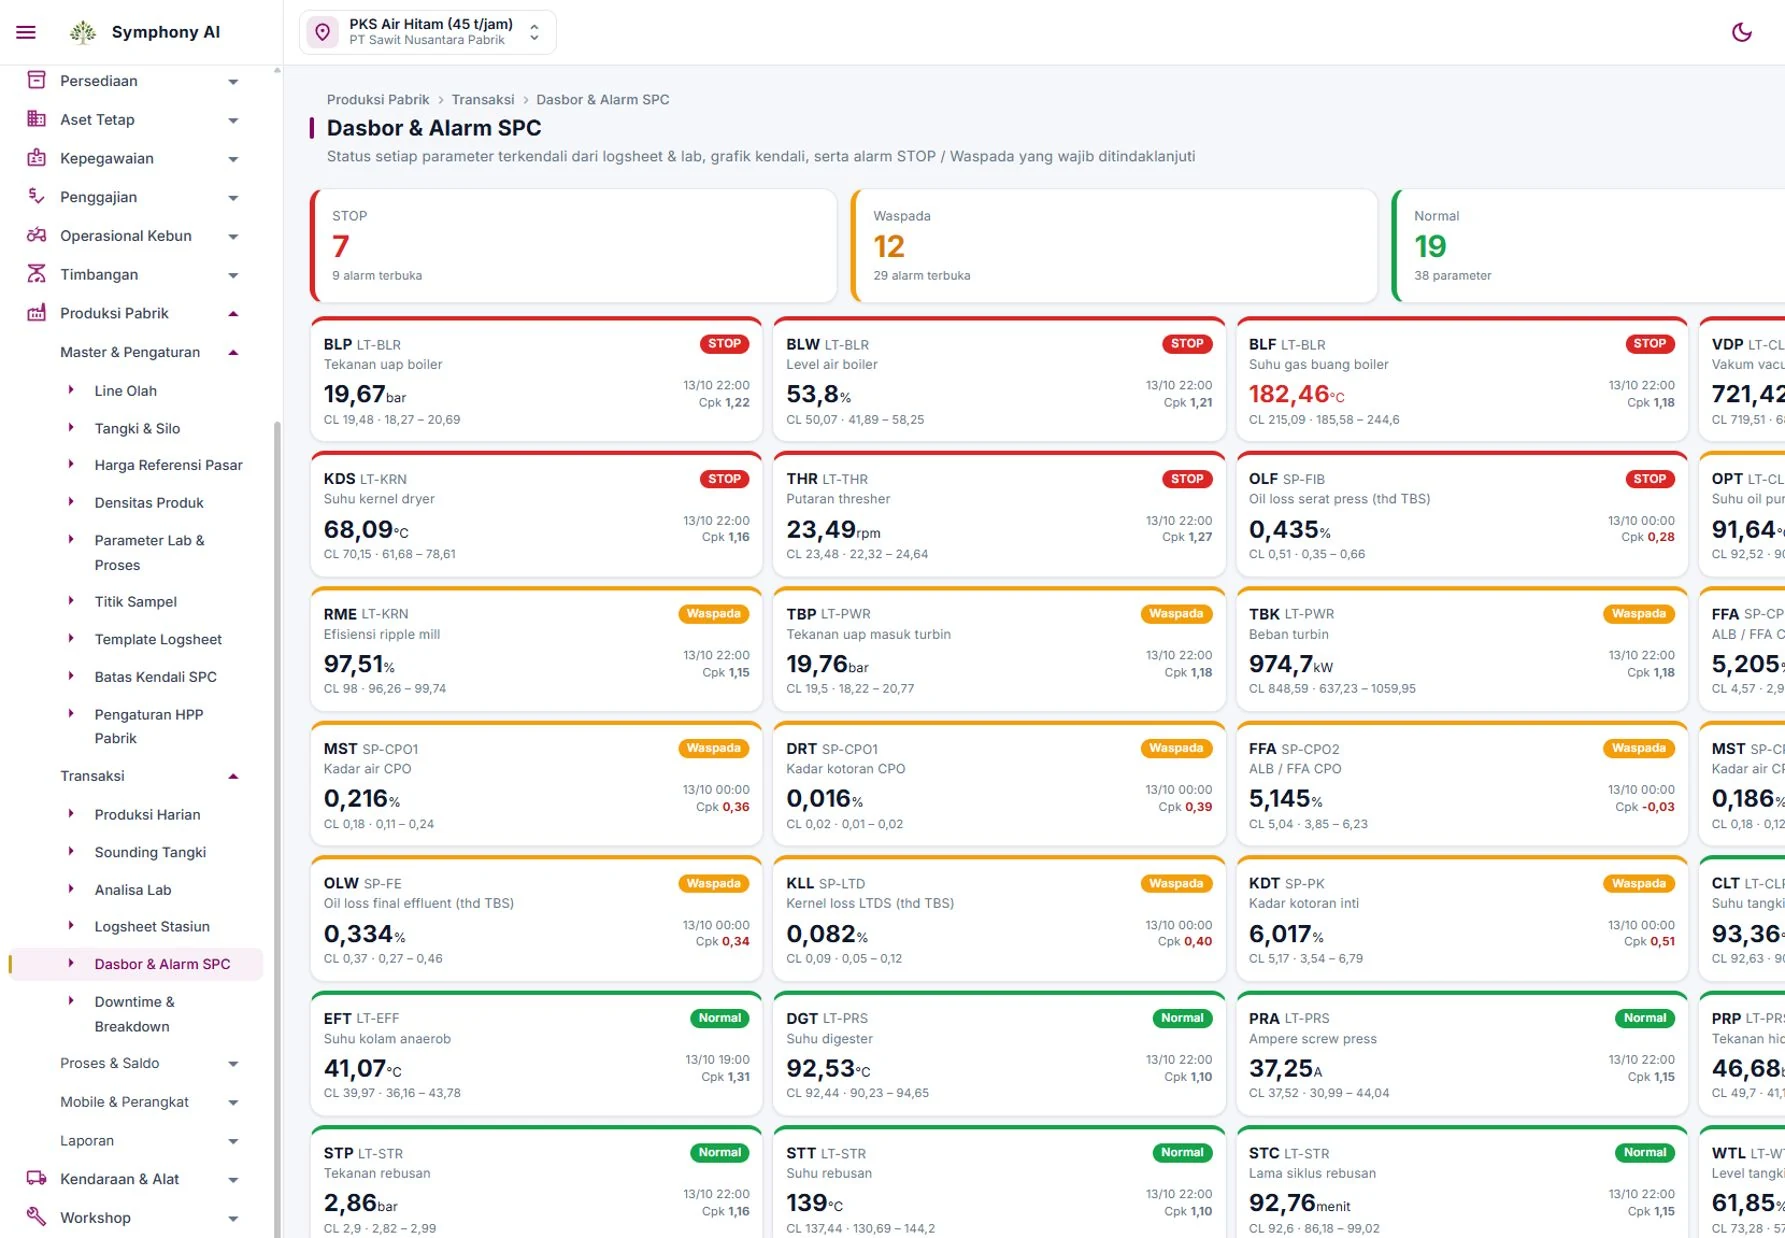
- SPC dashboard and alarms: the web dashboard shows control charts and flags readings and patterns that need attention.
- Optional SCADA integration: process data can be connected according to the mill’s systems and the agreed implementation scope.
- Connected to the ERP: alarms can be reviewed alongside production, OER, losses and mill costs.
Take this to your next mill review
- List the parameters that drive your largest oil losses.
- Check how readings are captured today and how often.
- Agree control-limit and alarm rules with the mill manager and lab.
- Name an owner for each alarm and a weekly review slot.
Common questions
Is SPC the same as checking readings against the specification?
No. Specification checks tell you whether one reading is acceptable. SPC looks at the pattern over time and warns when the process starts drifting, often before the specification is breached.
Do we need SCADA to use SPC?
No. Many mills start with readings from a mobile logsheet. SCADA integration is optional and can be added later.
Will SPC replace the lab or the operator?
No. SPC highlights where to look. Operators, the lab and the mill manager still decide on and carry out corrective actions.
See the SPC dashboard, mobile logsheet and mill screens, and discuss how they fit your mill.
View mill module →